" width="150.00000769304802px"><path d="M 0 0 L 9.184 0 L 9.184 1.944 L 0 1.944 Z" fill="rgb(21, 21, 21)" height="1.9444977770054663px" id="gOMgXCMyF" width="9.183673401240327px"/><path d="M 0 0 L 1.913 0 L 1.913 9.334 L 0 9.334 Z M 0 29.945 L 9.184 29.945 L 9.184 31.89 L 0 31.89 Z" fill="rgb(21, 21, 21)" height="31.88976450063828px" id="YKaIqSNTX" width="9.183673401240327px"/><path d="M 0 0 L 1.913 0 L 1.913 9.334 L 0 9.334 Z" fill="rgb(21, 21, 21)" height="9.33358932962625px" id="xNTPXemtb" transform="translate(0 22.556)" width="1.9132652919249722px"/><path d="M 0 0 L 9.184 0 L 9.184 1.944 L 0 1.944 Z" fill="rgb(255, 210, 0)" height="1.9444977770054663px" id="Zg1qA67Pc" transform="translate(140.816 0)" width="9.183673401240355px"/><path d="M 0 0 L 1.913 0 L 1.913 9.334 L 0 9.334 Z" fill="rgb(255, 210, 0)" height="9.333589329626221px" id="F6U7duLaT" transform="translate(148.087 0)" width="1.913265291925029px"/><path d="M 0 0 L 9.184 0 L 9.184 1.944 L 0 1.944 Z" fill="rgb(21, 21, 21)" height="1.9444977770054663px" id="vS19iM8bf" transform="translate(140.816 29.945)" width="9.183673401240355px"/><path d="M 135.077 14.558 L 136.99 14.558 L 136.99 23.891 L 135.077 23.891 Z M 4.898 11.072 C 5.528 11.072 6.009 10.838 6.34 10.371 C 6.673 9.902 6.84 9.222 6.84 8.331 C 6.84 7.44 6.673 6.761 6.34 6.294 C 6.009 5.825 5.528 5.59 4.898 5.59 C 4.269 5.59 3.785 5.826 3.446 6.297 C 3.109 6.767 2.941 7.445 2.941 8.331 C 2.941 9.217 3.109 9.895 3.446 10.366 C 3.785 10.836 4.269 11.072 4.898 11.072 Z M 2.941 5.013 C 3.348 4.468 3.798 4.066 4.291 3.807 C 4.784 3.549 5.351 3.42 5.993 3.42 C 7.127 3.42 8.059 3.878 8.786 4.794 C 9.516 5.71 9.881 6.889 9.881 8.331 C 9.881 9.773 9.516 10.953 8.786 11.871 C 8.059 12.787 7.127 13.246 5.993 13.246 C 5.351 13.246 4.784 13.116 4.291 12.858 C 3.798 12.597 3.348 12.195 2.941 11.649 L 2.941 13.002 L 0 13.002 L 0 0 L 2.941 0 Z M 18.892 6.192 C 18.634 6.069 18.377 5.979 18.121 5.922 C 17.867 5.863 17.611 5.834 17.353 5.834 C 16.597 5.834 16.015 6.081 15.606 6.575 C 15.197 7.067 14.993 7.772 14.993 8.69 L 14.993 13.002 L 12.052 13.002 L 12.052 3.644 L 14.993 3.644 L 14.993 5.182 C 15.372 4.569 15.806 4.122 16.295 3.842 C 16.786 3.56 17.375 3.42 18.06 3.42 C 18.159 3.42 18.265 3.424 18.379 3.433 C 18.495 3.44 18.662 3.458 18.881 3.486 Z M 29.544 8.299 L 29.544 9.149 L 22.665 9.149 C 22.735 9.852 22.984 10.378 23.412 10.729 C 23.84 11.081 24.437 11.256 25.204 11.256 C 25.823 11.256 26.457 11.163 27.106 10.976 C 27.756 10.788 28.425 10.506 29.11 10.128 L 29.11 12.433 C 28.414 12.7 27.718 12.902 27.021 13.039 C 26.325 13.177 25.629 13.246 24.933 13.246 C 23.267 13.246 21.971 12.815 21.047 11.954 C 20.125 11.093 19.663 9.885 19.663 8.331 C 19.663 6.805 20.117 5.606 21.023 4.733 C 21.93 3.857 23.179 3.42 24.77 3.42 C 26.216 3.42 27.374 3.863 28.242 4.748 C 29.11 5.633 29.544 6.816 29.544 8.299 Z M 26.519 7.304 C 26.519 6.736 26.356 6.278 26.03 5.93 C 25.704 5.581 25.277 5.406 24.751 5.406 C 24.181 5.406 23.718 5.569 23.362 5.895 C 23.006 6.221 22.784 6.691 22.697 7.304 Z M 35.899 8.791 C 35.286 8.791 34.823 8.897 34.513 9.109 C 34.204 9.319 34.05 9.631 34.05 10.045 C 34.05 10.423 34.174 10.72 34.423 10.935 C 34.674 11.149 35.021 11.256 35.465 11.256 C 36.018 11.256 36.483 11.055 36.862 10.652 C 37.241 10.247 37.43 9.741 37.43 9.133 L 37.43 8.791 Z M 40.398 7.663 L 40.398 13.002 L 37.43 13.002 L 37.43 11.614 C 37.036 12.183 36.591 12.597 36.096 12.858 C 35.604 13.116 35.004 13.246 34.297 13.246 C 33.343 13.246 32.569 12.963 31.974 12.398 C 31.38 11.831 31.083 11.097 31.083 10.195 C 31.083 9.097 31.453 8.292 32.195 7.78 C 32.939 7.267 34.105 7.01 35.694 7.01 L 37.43 7.01 L 37.43 6.778 C 37.43 6.304 37.246 5.957 36.878 5.738 C 36.511 5.517 35.939 5.406 35.16 5.406 C 34.53 5.406 33.944 5.47 33.4 5.599 C 32.858 5.727 32.354 5.919 31.887 6.176 L 31.887 3.896 C 32.519 3.739 33.152 3.62 33.787 3.54 C 34.423 3.46 35.059 3.42 35.694 3.42 C 37.355 3.42 38.554 3.752 39.29 4.417 C 40.029 5.082 40.398 6.164 40.398 7.663 Z M 43.136 0 L 46.077 0 L 46.077 7.077 L 49.466 3.644 L 52.885 3.644 L 48.387 7.938 L 53.238 13.002 L 49.671 13.002 L 46.077 9.101 L 46.077 13.002 L 43.136 13.002 Z" fill="rgb(21, 21, 21)" height="23.89126564493384px" id="BgbathAjS" transform="translate(13.01 7.972)" width="136.98980327397163px"/><path d="M 4.423 0 L 6.29 0 L 1.859 14.383 L 0 14.383 Z" fill="rgb(255, 210, 0)" height="14.383450056509389px" id="CwSlx98Zu" transform="translate(76.148 8.556)" width="6.290433626791241px"/><path d="M 6.921 11.414 C 6.516 11.959 6.069 12.36 5.58 12.617 C 5.092 12.874 4.528 13.002 3.888 13.002 C 2.764 13.002 1.834 12.553 1.1 11.655 C 0.367 10.754 0 9.607 0 8.214 C 0 6.816 0.367 5.671 1.1 4.778 C 1.834 3.883 2.764 3.436 3.888 3.436 C 4.528 3.436 5.092 3.564 5.58 3.821 C 6.069 4.075 6.516 4.479 6.921 5.032 L 6.921 3.644 L 9.881 3.644 L 9.881 12.058 C 9.881 13.563 9.414 14.712 8.479 15.505 C 7.544 16.298 6.189 16.694 4.414 16.694 C 3.839 16.694 3.282 16.65 2.744 16.561 C 2.207 16.472 1.668 16.335 1.126 16.152 L 1.126 13.82 C 1.64 14.122 2.143 14.346 2.636 14.494 C 3.13 14.642 3.627 14.716 4.125 14.716 C 5.09 14.716 5.796 14.501 6.245 14.072 C 6.696 13.642 6.921 12.971 6.921 12.058 Z M 4.98 5.59 C 4.371 5.59 3.897 5.819 3.557 6.278 C 3.218 6.734 3.049 7.379 3.049 8.214 C 3.049 9.073 3.213 9.723 3.541 10.165 C 3.871 10.607 4.35 10.829 4.98 10.829 C 5.594 10.829 6.071 10.6 6.411 10.144 C 6.751 9.688 6.921 9.044 6.921 8.214 C 6.921 7.379 6.751 6.734 6.411 6.278 C 6.071 5.819 5.594 5.59 4.98 5.59 Z M 12.71 0 L 15.651 0 L 15.651 13.002 L 12.71 13.002 Z M 22.606 8.791 C 21.992 8.791 21.53 8.897 21.22 9.109 C 20.911 9.319 20.757 9.631 20.757 10.045 C 20.757 10.423 20.881 10.72 21.13 10.935 C 21.381 11.149 21.728 11.256 22.172 11.256 C 22.724 11.256 23.19 11.055 23.569 10.652 C 23.948 10.247 24.137 9.741 24.137 9.133 L 24.137 8.791 Z M 27.104 7.663 L 27.104 13.002 L 24.137 13.002 L 24.137 11.614 C 23.742 12.183 23.298 12.597 22.803 12.858 C 22.31 13.116 21.711 13.246 21.004 13.246 C 20.05 13.246 19.275 12.963 18.681 12.398 C 18.086 11.831 17.789 11.097 17.789 10.195 C 17.789 9.097 18.16 8.292 18.902 7.78 C 19.646 7.267 20.812 7.01 22.401 7.01 L 24.137 7.01 L 24.137 6.778 C 24.137 6.304 23.953 5.957 23.584 5.738 C 23.218 5.517 22.646 5.406 21.867 5.406 C 21.237 5.406 20.651 5.47 20.107 5.599 C 19.565 5.727 19.06 5.919 18.594 6.176 L 18.594 3.896 C 19.225 3.739 19.858 3.62 20.493 3.54 C 21.13 3.46 21.766 3.42 22.401 3.42 C 24.062 3.42 25.26 3.752 25.997 4.417 C 26.735 5.082 27.104 6.164 27.104 7.663 Z M 37.035 3.936 L 37.035 6.208 C 36.405 5.941 35.797 5.74 35.209 5.607 C 34.623 5.473 34.07 5.406 33.549 5.406 C 32.99 5.406 32.574 5.477 32.302 5.62 C 32.032 5.763 31.897 5.981 31.897 6.275 C 31.897 6.516 32 6.7 32.205 6.829 C 32.41 6.955 32.778 7.05 33.31 7.112 L 33.828 7.187 C 35.336 7.381 36.35 7.701 36.869 8.147 C 37.39 8.592 37.65 9.292 37.65 10.246 C 37.65 11.242 37.288 11.991 36.564 12.494 C 35.841 12.995 34.763 13.246 33.328 13.246 C 32.72 13.246 32.09 13.196 31.439 13.098 C 30.79 13 30.123 12.854 29.438 12.66 L 29.438 10.387 C 30.025 10.676 30.627 10.893 31.242 11.04 C 31.859 11.184 32.486 11.256 33.121 11.256 C 33.697 11.256 34.13 11.176 34.42 11.016 C 34.711 10.853 34.857 10.613 34.857 10.294 C 34.857 10.026 34.757 9.827 34.557 9.697 C 34.357 9.567 33.958 9.466 33.36 9.393 L 32.842 9.326 C 31.531 9.158 30.613 8.849 30.087 8.398 C 29.561 7.947 29.298 7.262 29.298 6.342 C 29.298 5.351 29.632 4.616 30.3 4.139 C 30.97 3.659 31.995 3.42 33.375 3.42 C 33.919 3.42 34.489 3.461 35.085 3.545 C 35.684 3.627 36.334 3.757 37.035 3.936 Z M 47.056 3.936 L 47.056 6.208 C 46.427 5.941 45.818 5.74 45.231 5.607 C 44.645 5.473 44.091 5.406 43.571 5.406 C 43.011 5.406 42.595 5.477 42.324 5.62 C 42.054 5.763 41.918 5.981 41.918 6.275 C 41.918 6.516 42.021 6.7 42.226 6.829 C 42.432 6.955 42.8 7.05 43.331 7.112 L 43.849 7.187 C 45.358 7.381 46.372 7.701 46.891 8.147 C 47.412 8.592 47.672 9.292 47.672 10.246 C 47.672 11.242 47.31 11.991 46.585 12.494 C 45.863 12.995 44.784 13.246 43.35 13.246 C 42.741 13.246 42.111 13.196 41.461 13.098 C 40.812 13 40.145 12.854 39.459 12.66 L 39.459 10.387 C 40.046 10.676 40.648 10.893 41.263 11.04 C 41.881 11.184 42.507 11.256 43.142 11.256 C 43.719 11.256 44.152 11.176 44.441 11.016 C 44.732 10.853 44.878 10.613 44.878 10.294 C 44.878 10.026 44.778 9.827 44.578 9.697 C 44.378 9.567 43.979 9.466 43.381 9.393 L 42.863 9.326 C 41.553 9.158 40.635 8.849 40.109 8.398 C 39.583 7.947 39.32 7.262 39.32 6.342 C 39.32 5.351 39.654 4.616 40.322 4.139 C 40.992 3.659 42.017 3.42 43.397 3.42 C 43.941 3.42 44.511 3.461 45.107 3.545 C 45.705 3.627 46.355 3.757 47.056 3.936 Z" fill="rgb(21, 21, 21)" height="16.694290834220567px" id="dLc4QLWwi" transform="translate(93.176 7.972)" width="47.67206679668203px"/></g></svg>)

Table of contents
Share on Social Media
Nine types of research for thought leadership
Most consulting firms call something "research" when what they've actually done is read a few reports, charted what someone else found, and added a few opinions. That's not research. That's a literature review with decoration.
Thought leadership built on secondary sources gets ignored, because everyone else has access to the same sources. The work doesn't say anything that couldn't have been said by anyone else.
Research that drives thought leadership is different in four ways. It produces original data points that didn't exist before someone did the work. It uses a methodology that holds up when a sharp reader pokes at it. It generates findings designed to be quoted, charted, and dropped into a slide deck. And it answers a question the target audience genuinely cares about, not one the researcher finds interesting.
A bonus criterion separates the best programs from the rest: the research compounds over time. Year one is expensive. Year three is when the data becomes the citation.
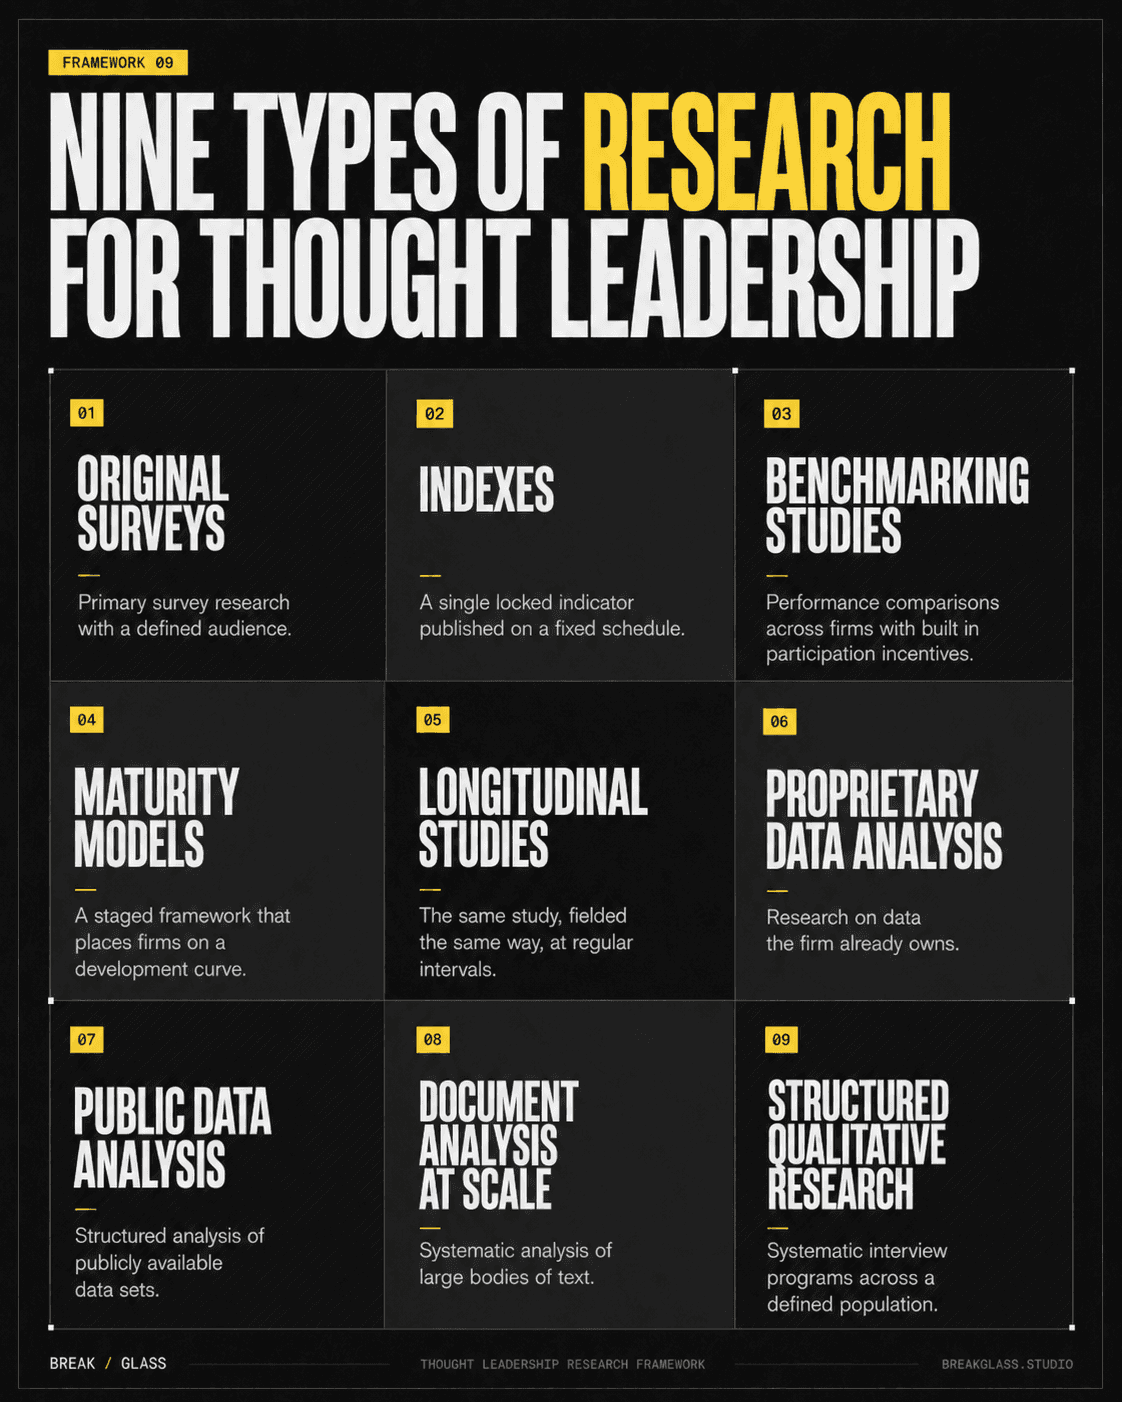
What follows is a working menu. Nine forms of research that produce the kind of output worth building thought leadership around, each with a different cost profile, different distribution dynamics, and different long-term IP characteristics.
Here's a quick bird's eye chart:
1. Original surveys
Primary survey research with a defined audience, usually fielded through a panel provider or recruited directly from the firm's network. Questions are designed to produce specific data points, and the data points become the findings. This is the form most firms reach for first when they decide to invest in research.
The hardest part is recruitment, not analysis. A clean panel of 200 mid-level executives at $50 to $90 per complete runs $10,000 to $18,000, and C-suite respondents cost meaningfully more.
What it's good for. Producing the largest volume of original, citable findings per research dollar when designed well. A single survey can generate enough data points to fuel a year of derivative content if the question set is structured around what the audience actually wants to know. Surveys also lend themselves naturally to charts, percentages, and headline statistics, which travel further than narrative findings.
Challenges. The most common failure mode is designing a survey that confirms what the firm already believes. Findings that surprise nobody don't get quoted, because nobody can quote a finding that everyone already agreed with. The discipline is to write questions whose answers you can't predict, which is harder than it sounds.
Examples:
2. Indexes
A single, methodology-locked indicator that gets republished on a fixed schedule. The Consumer Sentiment Index releases every month. The Case-Shiller Home Price Index releases monthly. Once the methodology is set, you don't change it. That's the entire point.
The value compounds. In year one, an index is a research project that costs money to publish. In year five, it's a citation. In year ten, journalists and analysts quote it without checking the source firm, because the firm has become synonymous with the question.
What it's good for. Building research IP that appreciates over time. No other research form produces this kind of long-term ownership of a topic. Once an index has a multi-year track record, it becomes structurally hard for competitors to dislodge, because they would have to publish their own version for years before catching up.
Challenges. Indexes are expensive to start because the methodology has to hold up to decades of scrutiny. The design choices made in year one constrain everything that follows. Picking the wrong indicator or the wrong measurement frame is hard to fix once the index has a public track record, because any methodology change breaks the comparability that's the whole point.
Examples:
3. Benchmarking studies
Performance comparisons across firms, almost always built on data that the audience itself contributes. Respondents fill out the benchmark survey because they want to see where they rank against peers. The benchmark gets more valuable as more firms participate, which makes recruitment easier each year.
The participation loop is the whole reason this form works. You're not asking people to give you data out of generosity. You're trading them a benchmark for it. The exchange is what scales.
What it's good for. Generating distribution alongside the data. Every participating firm shares the report with internal stakeholders to argue for budget or to validate a strategic choice. That's free distribution into the buying committee of every respondent's firm. Benchmarks also produce some of the most quotable single statistics in research, because rankings and percentile cutoffs are inherently citation-friendly.
Challenges. Benchmarks live or die on participation rates and sample quality. A benchmark built on 30 respondents from your friend list is not a benchmark. It's a focus group with a chart. Building a credible benchmark takes meaningful upfront investment in recruitment and methodology, and a few years of running it before the data set is large enough to support the claims you want to make.
Examples:
4. Maturity models
A staged framework that places a firm, team, or process on a development curve, usually with three to five levels. The framework comes with a diagnostic so participants can locate themselves on the curve. CMMI levels run Initial, Managed, Defined, Quantitatively Managed, and Optimizing, and most maturity models follow a similar shape.
The structural feature that makes maturity models unique: the firm that builds the model is almost always the firm that sells what gets buyers from one level to the next. A digital transformation maturity model is built by a digital transformation consultancy. The finding ("you're at Level 2") and the solution ("here's what gets you to Level 4") come from the same source.
What it's good for. Embedding the firm's service offering inside the research finding. This makes maturity models structurally efficient as both research and pipeline tool, because the diagnostic itself produces a qualified buying conversation. A firm that scores low on the diagnostic has been told, in their own data, that they need help.
Challenges. The category is dense with vendor self-serving versions where the model conveniently shows that everyone is at Level 2 and only the publishing firm can move them up. Buyers see through this quickly. Credibility hinges on whether the model produces findings the publishing firm wouldn't have written on its own, and on whether the criteria for each level reflect something more than what the firm happens to sell.
Examples:
5. Longitudinal studies
The same study, fielded the same way, at regular intervals. Year over year comparisons become the central finding. Every annual release earns the right to claim what changed.
Closely related to indexes, but not the same thing. An index is a single locked indicator. A longitudinal study can be a full multi-question survey re-run annually, where the analytical value is in the patterns across questions and across years.
What it's good for. Generating a permanent editorial calendar item. A longitudinal study gives the firm a built-in annual publication moment with news baked in ("year over year, X moved from 47% to 62%"). It also creates an internal data set that gets richer with each release, which means later years' analysis can do things the first year couldn't, including segmentation, cohort tracking, and event studies tied to external shocks.
Challenges. The discipline is in the consistency. The temptation to change questions, swap panels, or adjust methodology between years has to be resisted, because any change breaks the year-over-year comparison that's the entire point. The studies that last decades are run by teams who treat methodological consistency as a non-negotiable, even when it costs them on individual releases.
Examples:
6. Proprietary data analysis
Research conducted on data the firm already owns. Client engagement data, internal operations data, product usage data if the firm has a product, anonymized client outcomes. The data was created in the course of doing the work. The research is in the analysis.
The data acquisition cost is effectively zero, because the data was already collected for other reasons. The work is in deciding what question to ask of it and producing analysis that holds up.
What it's good for. Producing the most defensible research possible. Nobody else can replicate it, because nobody else has the data. Competitors can run the same survey and get similar results. They can't run the same analysis of your internal data. For firms that sit on rich proprietary data sets, this is usually the highest-leverage form of research available.
Challenges. The constraint is generalizability. Whether the firm's internal data represents something broader than itself is the question every smart reader asks first. Stripe can publish on the internet economy because Stripe processes a meaningful share of internet commerce. A boutique firm with 40 clients can publish on those 40 clients but probably can't generalize. The honest framing matters. Readers can tell when a sample is being overclaimed.
Examples:
7. Public data analysis
Structured analysis of data that exists in public form. Government statistics, regulatory filings, scraped websites, conference programs, court records, academic data sets, industry databases. The data is available to everyone, which means the research lives or dies on the analysis.
The cost economics shifted dramatically in the last two years. Tasks that used to require a research assistant for a month, like collecting data from 500 websites or classifying job postings, now run in an afternoon with AI tooling.
What it's good for. Producing strong research at a fraction of the cost of survey-based work. Firms that didn't have research budgets two years ago can now produce serious public data analysis with a single analyst and a Claude API key. This is also the most flexible form, because the data is already there and a new analytical angle is usually one query away.
Challenges. Everyone else has the same tools, which means the bar for what counts as good public data analysis is rising fast. A sloppy analysis is worse than no analysis, because someone will check the work and the firm gets remembered for the error. The opportunity is real, but the analytical rigor required is higher than it was, even though the data is easier to get.
Examples:
8. Document analysis at scale
Systematic analysis of large bodies of text. Earnings call transcripts, 10-Ks, court filings, job descriptions, RFPs, news articles, regulatory comment letters, academic papers. The methodology is intuitive ("we read every X and counted Y") which makes the findings easy to defend.
This was impractical at any meaningful scale before large language models. A human research team could read maybe 200 earnings transcripts a week with reasonable consistency. An AI pipeline can process 20,000 with consistent classification.
What it's good for. Producing findings that feel definitive because the methodology is exhaustive rather than sampled. Counting the number of S&P 500 companies that mentioned AI in their last quarterly call. Tracking the shift in language about remote work across legal filings from 2019 to 2024. Documenting the change in skills requested in finance director job postings over five years. These are claims nobody else has bothered to make at scale, and they tend to surprise because volume reveals patterns no individual reader could catch.
Challenges. The trap is letting the volume of data substitute for the analytical question. Counting words in earnings transcripts is easy. Knowing which words to count, and what conclusion the counts actually support, is much harder. Document analysis that finds something surprising requires a real hypothesis to start. Findings of the form "we processed 50,000 documents and the most common word was 'the'" are technically correct and entirely useless.
Examples:
9. Structured qualitative research
Systematic interview programs across a defined population, not the scattered anecdotal interviews most firms call qualitative research. The discipline is in the structure: a defined sample frame, a consistent interview protocol, transcription and coding of responses, and findings that summarize across interviews rather than cherry-picking the best quote.
Qualitative work captures what surveys miss. Surveys ask the questions the researcher already knows to ask. Interviews surface the questions the researcher didn't know to ask.
What it's good for. Producing the texture and language that quantitative research can't generate. The combination of a survey and 20 to 40 structured interviews almost always produces a sharper report than either form alone. Qualitative work also produces pull quotes at volume, and a sharp executive quote spreads on social platforms better than a chart does, in part because it sounds like a person talking.
Challenges. It's slower and harder to scale than survey work, and most firms either skip it or do it sloppily as a result. Anecdotal interviews that didn't follow a protocol can't support claims about a population, which means the findings have to be framed carefully. The other risk is over-relying on a few articulate respondents whose quotes are good but whose views aren't representative.
Examples:
How to pick one and commit to it
The most common mistake is picking three forms and doing all of them badly. The second most common is picking one form and abandoning it after a year because the first release didn't break the internet.
A practical decision frame comes down to three questions.
First, what's the budget. Original surveys and full longitudinal programs cost real money. Public data analysis and document analysis at scale cost almost nothing once tooling is set up. If the annual research budget is under $20,000, start with public data or document analysis. If it's $50,000 or more, surveys and indexes become viable.
Second, does the audience want benchmarks or narrative. Benchmarking and maturity models work for audiences that want to know where they rank. Qualitative research and indexes work for audiences that want a story or a number to track. The audience determines the form, not the firm's preferences.
Third, do you want a one-time hit or compounding IP. A single survey will produce one good report. An index, a longitudinal study, or a recurring benchmark will produce ten years of compounding citation value. The choice is real, and the compounding forms are almost always the better long-term bet for firms with the patience to wait three years for the payoff.
Whatever the answer, the form matters less than the discipline of running it well for long enough to matter. Pick one. Run it for three years before evaluating whether it worked. Most firms quit at year one because year one looks underwhelming compared to expectations. The firms whose research everyone cites are the firms that didn't quit.
Nine types of research for thought leadership
Most consulting firms call something "research" when what they've actually done is read a few reports, charted what someone else found, and added a few opinions. That's not research. That's a literature review with decoration.
Thought leadership built on secondary sources gets ignored, because everyone else has access to the same sources. The work doesn't say anything that couldn't have been said by anyone else.
Research that drives thought leadership is different in four ways. It produces original data points that didn't exist before someone did the work. It uses a methodology that holds up when a sharp reader pokes at it. It generates findings designed to be quoted, charted, and dropped into a slide deck. And it answers a question the target audience genuinely cares about, not one the researcher finds interesting.
A bonus criterion separates the best programs from the rest: the research compounds over time. Year one is expensive. Year three is when the data becomes the citation.
What follows is a working menu. Nine forms of research that produce the kind of output worth building thought leadership around, each with a different cost profile, different distribution dynamics, and different long-term IP characteristics.
Here's a quick bird's eye chart:
1. Original surveys
Primary survey research with a defined audience, usually fielded through a panel provider or recruited directly from the firm's network. Questions are designed to produce specific data points, and the data points become the findings. This is the form most firms reach for first when they decide to invest in research.
The hardest part is recruitment, not analysis. A clean panel of 200 mid-level executives at $50 to $90 per complete runs $10,000 to $18,000, and C-suite respondents cost meaningfully more.
What it's good for. Producing the largest volume of original, citable findings per research dollar when designed well. A single survey can generate enough data points to fuel a year of derivative content if the question set is structured around what the audience actually wants to know. Surveys also lend themselves naturally to charts, percentages, and headline statistics, which travel further than narrative findings.
Challenges. The most common failure mode is designing a survey that confirms what the firm already believes. Findings that surprise nobody don't get quoted, because nobody can quote a finding that everyone already agreed with. The discipline is to write questions whose answers you can't predict, which is harder than it sounds.
Examples:
2. Indexes
A single, methodology-locked indicator that gets republished on a fixed schedule. The Consumer Sentiment Index releases every month. The Case-Shiller Home Price Index releases monthly. Once the methodology is set, you don't change it. That's the entire point.
The value compounds. In year one, an index is a research project that costs money to publish. In year five, it's a citation. In year ten, journalists and analysts quote it without checking the source firm, because the firm has become synonymous with the question.
What it's good for. Building research IP that appreciates over time. No other research form produces this kind of long-term ownership of a topic. Once an index has a multi-year track record, it becomes structurally hard for competitors to dislodge, because they would have to publish their own version for years before catching up.
Challenges. Indexes are expensive to start because the methodology has to hold up to decades of scrutiny. The design choices made in year one constrain everything that follows. Picking the wrong indicator or the wrong measurement frame is hard to fix once the index has a public track record, because any methodology change breaks the comparability that's the whole point.
Examples:
3. Benchmarking studies
Performance comparisons across firms, almost always built on data that the audience itself contributes. Respondents fill out the benchmark survey because they want to see where they rank against peers. The benchmark gets more valuable as more firms participate, which makes recruitment easier each year.
The participation loop is the whole reason this form works. You're not asking people to give you data out of generosity. You're trading them a benchmark for it. The exchange is what scales.
What it's good for. Generating distribution alongside the data. Every participating firm shares the report with internal stakeholders to argue for budget or to validate a strategic choice. That's free distribution into the buying committee of every respondent's firm. Benchmarks also produce some of the most quotable single statistics in research, because rankings and percentile cutoffs are inherently citation-friendly.
Challenges. Benchmarks live or die on participation rates and sample quality. A benchmark built on 30 respondents from your friend list is not a benchmark. It's a focus group with a chart. Building a credible benchmark takes meaningful upfront investment in recruitment and methodology, and a few years of running it before the data set is large enough to support the claims you want to make.
Examples:
4. Maturity models
A staged framework that places a firm, team, or process on a development curve, usually with three to five levels. The framework comes with a diagnostic so participants can locate themselves on the curve. CMMI levels run Initial, Managed, Defined, Quantitatively Managed, and Optimizing, and most maturity models follow a similar shape.
The structural feature that makes maturity models unique: the firm that builds the model is almost always the firm that sells what gets buyers from one level to the next. A digital transformation maturity model is built by a digital transformation consultancy. The finding ("you're at Level 2") and the solution ("here's what gets you to Level 4") come from the same source.
What it's good for. Embedding the firm's service offering inside the research finding. This makes maturity models structurally efficient as both research and pipeline tool, because the diagnostic itself produces a qualified buying conversation. A firm that scores low on the diagnostic has been told, in their own data, that they need help.
Challenges. The category is dense with vendor self-serving versions where the model conveniently shows that everyone is at Level 2 and only the publishing firm can move them up. Buyers see through this quickly. Credibility hinges on whether the model produces findings the publishing firm wouldn't have written on its own, and on whether the criteria for each level reflect something more than what the firm happens to sell.
Examples:
5. Longitudinal studies
The same study, fielded the same way, at regular intervals. Year over year comparisons become the central finding. Every annual release earns the right to claim what changed.
Closely related to indexes, but not the same thing. An index is a single locked indicator. A longitudinal study can be a full multi-question survey re-run annually, where the analytical value is in the patterns across questions and across years.
What it's good for. Generating a permanent editorial calendar item. A longitudinal study gives the firm a built-in annual publication moment with news baked in ("year over year, X moved from 47% to 62%"). It also creates an internal data set that gets richer with each release, which means later years' analysis can do things the first year couldn't, including segmentation, cohort tracking, and event studies tied to external shocks.
Challenges. The discipline is in the consistency. The temptation to change questions, swap panels, or adjust methodology between years has to be resisted, because any change breaks the year-over-year comparison that's the entire point. The studies that last decades are run by teams who treat methodological consistency as a non-negotiable, even when it costs them on individual releases.
Examples:
6. Proprietary data analysis
Research conducted on data the firm already owns. Client engagement data, internal operations data, product usage data if the firm has a product, anonymized client outcomes. The data was created in the course of doing the work. The research is in the analysis.
The data acquisition cost is effectively zero, because the data was already collected for other reasons. The work is in deciding what question to ask of it and producing analysis that holds up.
What it's good for. Producing the most defensible research possible. Nobody else can replicate it, because nobody else has the data. Competitors can run the same survey and get similar results. They can't run the same analysis of your internal data. For firms that sit on rich proprietary data sets, this is usually the highest-leverage form of research available.
Challenges. The constraint is generalizability. Whether the firm's internal data represents something broader than itself is the question every smart reader asks first. Stripe can publish on the internet economy because Stripe processes a meaningful share of internet commerce. A boutique firm with 40 clients can publish on those 40 clients but probably can't generalize. The honest framing matters. Readers can tell when a sample is being overclaimed.
Examples:
7. Public data analysis
Structured analysis of data that exists in public form. Government statistics, regulatory filings, scraped websites, conference programs, court records, academic data sets, industry databases. The data is available to everyone, which means the research lives or dies on the analysis.
The cost economics shifted dramatically in the last two years. Tasks that used to require a research assistant for a month, like collecting data from 500 websites or classifying job postings, now run in an afternoon with AI tooling.
What it's good for. Producing strong research at a fraction of the cost of survey-based work. Firms that didn't have research budgets two years ago can now produce serious public data analysis with a single analyst and a Claude API key. This is also the most flexible form, because the data is already there and a new analytical angle is usually one query away.
Challenges. Everyone else has the same tools, which means the bar for what counts as good public data analysis is rising fast. A sloppy analysis is worse than no analysis, because someone will check the work and the firm gets remembered for the error. The opportunity is real, but the analytical rigor required is higher than it was, even though the data is easier to get.
Examples:
8. Document analysis at scale
Systematic analysis of large bodies of text. Earnings call transcripts, 10-Ks, court filings, job descriptions, RFPs, news articles, regulatory comment letters, academic papers. The methodology is intuitive ("we read every X and counted Y") which makes the findings easy to defend.
This was impractical at any meaningful scale before large language models. A human research team could read maybe 200 earnings transcripts a week with reasonable consistency. An AI pipeline can process 20,000 with consistent classification.
What it's good for. Producing findings that feel definitive because the methodology is exhaustive rather than sampled. Counting the number of S&P 500 companies that mentioned AI in their last quarterly call. Tracking the shift in language about remote work across legal filings from 2019 to 2024. Documenting the change in skills requested in finance director job postings over five years. These are claims nobody else has bothered to make at scale, and they tend to surprise because volume reveals patterns no individual reader could catch.
Challenges. The trap is letting the volume of data substitute for the analytical question. Counting words in earnings transcripts is easy. Knowing which words to count, and what conclusion the counts actually support, is much harder. Document analysis that finds something surprising requires a real hypothesis to start. Findings of the form "we processed 50,000 documents and the most common word was 'the'" are technically correct and entirely useless.
Examples:
9. Structured qualitative research
Systematic interview programs across a defined population, not the scattered anecdotal interviews most firms call qualitative research. The discipline is in the structure: a defined sample frame, a consistent interview protocol, transcription and coding of responses, and findings that summarize across interviews rather than cherry-picking the best quote.
Qualitative work captures what surveys miss. Surveys ask the questions the researcher already knows to ask. Interviews surface the questions the researcher didn't know to ask.
What it's good for. Producing the texture and language that quantitative research can't generate. The combination of a survey and 20 to 40 structured interviews almost always produces a sharper report than either form alone. Qualitative work also produces pull quotes at volume, and a sharp executive quote spreads on social platforms better than a chart does, in part because it sounds like a person talking.
Challenges. It's slower and harder to scale than survey work, and most firms either skip it or do it sloppily as a result. Anecdotal interviews that didn't follow a protocol can't support claims about a population, which means the findings have to be framed carefully. The other risk is over-relying on a few articulate respondents whose quotes are good but whose views aren't representative.
Examples:
How to pick one and commit to it
The most common mistake is picking three forms and doing all of them badly. The second most common is picking one form and abandoning it after a year because the first release didn't break the internet.
A practical decision frame comes down to three questions.
First, what's the budget. Original surveys and full longitudinal programs cost real money. Public data analysis and document analysis at scale cost almost nothing once tooling is set up. If the annual research budget is under $20,000, start with public data or document analysis. If it's $50,000 or more, surveys and indexes become viable.
Second, does the audience want benchmarks or narrative. Benchmarking and maturity models work for audiences that want to know where they rank. Qualitative research and indexes work for audiences that want a story or a number to track. The audience determines the form, not the firm's preferences.
Third, do you want a one-time hit or compounding IP. A single survey will produce one good report. An index, a longitudinal study, or a recurring benchmark will produce ten years of compounding citation value. The choice is real, and the compounding forms are almost always the better long-term bet for firms with the patience to wait three years for the payoff.
Whatever the answer, the form matters less than the discipline of running it well for long enough to matter. Pick one. Run it for three years before evaluating whether it worked. Most firms quit at year one because year one looks underwhelming compared to expectations. The firms whose research everyone cites are the firms that didn't quit.